POC Setup and Configuration checklist
Table Of Content
- Install and Configure the Collector, GIM and S-TAPs
- Software Download
- Install and Configure the Collector
3. Verify that the client created the VMWare with the Recommended Specs for POCs
4. Import the collector OVA and configure the network
5. Confirm the port requirements - Install and Configure the S-TAP
6. Install the GIM Agent
1. Diagnostics
7. Install the S-TAP using the GIM Agent and Supervisor
2. Diagnostics
8. Verify that the date & time are the same on the collector and the database server
9. Download the scripts for creating a user and roles for VA and Classifier - Prepare the Collector
10. Apply the PoC license keys and confirm that the guardium user has all appropriate roles selected
11. Check the S-TAP status and inspection engine default configuration
12. Confirm the inspection engines were configured automatically during the S-TAP installation, if not, create them manually
13. Confirm that Quick Search is active
14. Confirm that Outlier Detection is active
15. Confirm that Threat Analytics is active
16. Confirm that the alerter is on at startup
17. Run the Smoke Test
18. Configure VA
19. Review the activity
20. Reinstall the policy after adding group members
21. Use the Policy Analyzer
22. Smart Assistant will be pre-configured for GDPR as the test case
23. Review the GDPR reports as they begin to populate
24. Check on the Active Threat Analytics and Risk Spotter on occasion
25. Check the Dashboard Reports
26. Show compliance dashboard, Data Protection dashboard, etc
27. Set up audit process work flow
28. Send violations to messages report (SYSLOG)
29. Entitlement Reports
30. Vulnerability Assessment
- Standard Client Use Cases for Guardium Data Protection
31. Client Use Case: Reduce the data risk landscape
32. Client Use Case: Identify servers that might be under attack or there is a possible attempt at unauthorized usage
33. Client Use Case: Meet audit and compliance requirements
34. Client Use Case: Provide C-Level executives with a sense of data security across the enterprise
35. Client Use Case: Identify anomalous behavior
36. Client Use Case: Ease of implementation, scale and maintenance
37. Client Use Case: Reduction in reliance on IT department resources through the use of automation where applicable
38. Client Use Case: Integration with appropriate product solutions that are already in use (don't want to rip & replace) - PoC Wrap-Up
39. Create the PoC Wrap Up Document and present the results
Install and Configure the Collector, GIM and S-TAPs
Software Download
Send the ‘Guardium V11 PoC OVA Download and Configuration Links.pdf’ file to the prospective client.
Confirm that the client has downloaded the PoC OVA
Filename = GuardiumV11.2_POCCollector_20200615.ova (approx.. 19.1 GB) (This version will change with new releases)
Guardium version: v11.2
BOX link download password = <will be supplied by your IBM Guardium SME> [for CTPs to supply to client: guardium ]
BOX download link = https://ibm.box.com/s/i41xuhkgo8nav319hbc72f2exkn1rbik
Confirm that the client has downloaded the GIM and S-TAP bundles
Log into IBM Fix Central and create an IBM ID (if you do not already have one) to access the downloads: https:// www-945.ibm.com/support/fixcentral/
In this example, we will install a GIM agent and an S-TAP agent on a RHEL server.
Install and Configure the Collector
Verify that the client created the VMWare with the Recommended Specs for POCs
vCPU = 8
RAM = 32GB
Disk = 300GB
Import the collector OVA and configure the network
Login Information:
cli / guardium
admin / guardium
accessmgr / guardium
log into the collector as cli / guardium
store network interface ip <ip_address>/24
store network interface mask <subnet_mask> - this command is deprecated so now we use use the /24 on the previous command
restart network (‘setting solr’ can take up to 5 minutes depending on the speed of the machine, so be patient)
Note: prior to restarting the network, confirm that the vmware settings will still allow you to connect using the new ip address
store network routes defaultroute <default_router_ip>
store network resolver <resolver_1_ip>
store alerter smtp relay <smtp_server_ip>
store alerter smtp returnaddr <first.last@company.com>
store alerter state startup on
store system hostname <host_name>
store system domain <domain_name>
store system ntp server <ntp_server_ip>
store system ntp state on
restart system
Check the settings:
show network interface all
show network routes defaultroute
show network resolver all
show system hostname
show system domain
show system clock timezone (if you need to change the timezone, do not change it in the same session as changing the hostname, restart system after changing the hostname and then change the timezone)
to change the timezone: first check the timezone (show system clock timezone), then type store system clock timezone list (to see the available time zone syntax list), then store system clock timezone <timezone>
show system clock datetime
to change the time: store system clock datetime <YYYY-mm-dd> <hh:mm:ss>
show system ntp all
show unit type
from the database server, confirm that the required ports are open:
nmap -p 8443 <collector-ip-address>
nmap -p 8444 <collector-ip-address>
nmap -p 8445 <collector-ip-address>
nmap -p 8446 <collector-ip-address>
nmap -p 8081 <collector-ip-address>
nmap -p 16016 <collector-ip-address> (bi-dir communication, heartbeat, clear)
nmap -p 16018 <collector-ip-address> (bi-dir comm, heartbeat, TLS)
nmap -p 16020 <collector-ip-address> (connection pooling, clear, optional)
nmap -p 16021 <collector-ip-address> (connection pooling, TLS, optional)
for GIM:
Confirm the port requirements
- 8445: GIM client listener, both directions. Any GIM server on either the Central Manager or the collector can reach out to it (the GIM client).
- 8443: (discovery) on the DB server to allow communication from the DB server to the Guardium appliance, and for uploading features.
- 8446: Used between the GIM client and the GIM server (on the Central Manager or collector) for authenticated TLS, both directions, custom kernel upload, must gather loggers upload. (IF port 8446 is NOT open, then it defaults to 8444, BUT no certificate is passed (for example, TLS without verification.)
- 8081: Used between the GIM client and the GIM server (on the Central Manager or collector) for non-TLS (but with message signing verification), not authenticated), both directions, custom kernel upload, must gather loggers upload. This is to support V10 GIM clients working with GIM_USE_SSL=0.
Install and Configure the S-TAP
Install the GIM Agent
Pre-requisites:
- The GIM client and S-TAP must always be installed by root or admin
- Check with your prospective client to determine if a support ticket will need to be opened by the client to create groups/users for the S-TAP installation.


- The GIM client uses port 8446 (or 8444, see details in a prior section) to communicate with the GIM server.
- Required directories:

Review these disk space requirements before you install an S-TAP or any associated agent.


The GIM client agent monitors the processes that you install by using GIM. It checks the heartbeat of each process once each minute and passes status changes for the processes to the GIM server. The status of each process is displayed on the Process Monitoring panel.
Prerequisites for GIM Agent:
Software and Disk Space requirements
- Perl 5.8 (and up)
- 1GB of space to accommodate all GIM modules (including maintaining a copy of the previous and current installed versions). Without FAM, 300MB.
Place the GIM client installer on the database server in any folder.
Run the installer: ./<installer_name> [-- --dir <install_dir> <--sqlguardip> <g-machine ip> --tapip <db server ip address> --perl <perl dir> -q]
The installer name has the syntax: guard-bundle-GIM-<release build>-<DB>-<OS>_<bit>.gim.sh, for example:
guard-bundle-GIM-10.5.0_r103224_v10_5_1-rhel-6-linux-x86_64.gim.sh
On Red Hat Linux, version 6 or later, run these commands to verify that the files have been added:
ls -la /etc/init/gim*
ls -la /etc/gsvr*
Enter this command to verify that the GIM client, SUPERVISOR process, and modules are running:
ps -afe | grep modules
Log in to the Guardium system and check the Process Monitoring status.


Diagnostics
grdapi gim_run_diagnostics clientIP=xx.xx.xx.xx
- Use the check boxes next to each client to choose the clients for which you want to run GIM diagnostics.
- Click Run diagnostics.
The next time that each client polls the GIM server for updates, it will receive the diagnostic command and run it immediately.
You can review the results in the GIM_EVENTS report.
If there are issues that are not easily identified and fixed, engage the #guardium_poc_swat Slack Channel.
Install the S-TAP using the GIM Agent and Supervisor
- Upload the relevant S-TAP module to the Guardium Installation Manager appliance:
- Go to Manage > Module Installation > Upload Modules.
- Click Choose File and select the S-TAP module that you want to install.
- Click Upload to upload the module to the appliance.
The module appears in the Import Uploaded Modules table.
- In the Import Uploaded Modules table, click the check box next to the S-TAP module you want to install.
The module imports and becomes available for installation. The Upload Modules page resets and the Import Uploaded Modules table is now empty.
- Navigate to Manage > Module Installation > Set up by Client.
- In the Choose clients section, select the database servers where you want to install the S-TAP module. Select individual clients using check boxes in the table, or use the Select client group menu to select a group of clients. Click Next to continue.
- In the Choose bundle section, use the Select a bundle menu to identify the software you want to install.
- After selecting a software bundle, the Selected bundle action column indicates Install, the action that will be performed for each client:
In the Choose parameters section, specify values for required and optional parameters. Use the  or
or  to add or remove optional parameters. Use the
  icon to search for parameters by name or description.
These parameters are mandatory:
- STAP_TAP_IP: the IP address or FQDN of the database server or node on which the STAP is being installed (equivalent to the -taphost command line parameter). If not specified, the GIM_CLIENT_IP value is used.
- STAP_SQLGUARD_IP: the IP address or FQDN of the primary collector with which this STAP communicates (equivalent to the -appliance command line parameter). If not specified, then, the GIM_URL value is used.
- In the Configure clients section, use the table to review and edit parameter values for each client.
- Editable parameters show a
 icon next to the parameter value. Click the icon to edit the value.
 - Click Install to begin the software installation. Use the
 icon to schedule the installation, then click OK to continue.

On the monitored database server, confirm that the S-TAP is installed:
ps -aef | grep tap
Diagnostics
The installation process creates log files for the entire S-TAP package (S-TAP, K-TAP, A-TAP, PCAP, Discovery). The log files are good for troubleshooting failed installations. Locations include /var/tmp, /tmp, and /var/log.
The installation process updates inittab, upstart, and rc scripts.
S-TAP installs into /usr/local/guardium
(depending on the monitored database server – determine if a reboot or restart is necessary https://www.ibm.com/support/knowledgecenter/SSMPHH_11.1.0/com.ibm.guardium.doc.stap/stap/when_to_restart_when_to_reboot_linux.html )
If not already done, check that the ports between the guardium collector and the database server are open.
From the cli command prompt on the collector:
Support show port open <database-server-ip-address> 16016
*OR*
Check them from the database server as described in a previous section of this document as shown in this example:

Verify that the date & time are the same on the collector and the database server
On the collector appliance, log into the cli and issue the following commands:
- show system clock datetime
- if needed, modify with this command: store system clock datetime yyyy-mm-dd hh:mm:ss
Download the scripts for creating a user and roles for VA and Classifier
From the collector appliance cli prompt, initialize the fileserver using the following CLI command:
fileserver [ip_address] <number of seconds to keep the session alive, e.g. 3600>
where [ip_address] is the system being used to connect to the Guardium system
Then in a browser session, connect to the appliance: https://<collector ip address>:8445


Then choose the appropriate script based on the database type that you are going to monitor. In this example, we choose PostgreSQL:


Select & copy or use filezilla or some other app to download the .sql file:
--===================================================================================
-- ------------------------------
-- Description
-- ------------------------------
-- Database Type: Oracle
--
-- This script creates a ‘G_CLASSIFIER’ role required for Classification on the database.
--
-- Note: This script grants the require privileges to perform the Guardium classification scan.
-- select any table
-- select any dictionary
--
-- ------------------------------
-- before running this script
-- ------------------------------
-- Nothing
--
-- ------------------------------
-- after running this script
-- ------------------------------
-- need to assign this role to user(s) using the following command:
-- GRANT g_classifier to <username>;
--
-- ------------------------------
-- User/Password to use
-- ------------------------------
-- User: user defined (<username>)
-- Pass: user defined
-- Role: G_CLASSIFIER
--===================================================================================
spool classifier-ora.log
set serveroutput on format wrapped size 1000000;
set linesize 80
set pagesize 44
clear scr
declare
type RoleMembers is table of DBA_ROLE_PRIVS.GRANTEE%type;
members RoleMembers;
objectExists number;
memberCount number;
type Funs is table of varchar2(255);
begin
dbms_output.put_line(‘>>>========================================================->>>’);
dbms_output.put_line(‘>>> Creating the G_CLASSIFIER role…’);
dbms_output.put_line(‘>>>========================================================->>>’);
-- Check whether the role already exists
dbms_output.put_line(‘-> Checking whether role: “G_CLASSIFIER” already exists.’);
begin
select 1 into objectExists
from DBA_ROLES
where ROLE = ‘G_CLASSIFIER’;
exception
when NO_DATA_FOUND then
objectExists := 0;
end;
-- If the role exists, preserve the users and drop the role
if (objectExists = 1) then
dbms_output.put_line(‘-> Role: “G_CLASSIFIER” exists.’);
-- Get the count of members for later iteration
select count(*) into memberCount
from DBA_ROLE_PRIVS prv
where prv.GRANTED_ROLE = ‘G_CLASSIFIER’;
-- If we have members, capture them for later re-adding
if (memberCount > 0) then
dbms_output.put_line(‘-> Preserving (‘ || memberCount || ‘) G_CLASSIFIER role members.’);
select prv.GRANTEE bulk collect into members
from DBA_ROLE_PRIVS prv
where prv.GRANTED_ROLE = ‘G_CLASSIFIER’;
end if;
-- Drop the role
dbms_output.put_line(‘-> Dropping role: “G_CLASSIFIER”’);
execute immediate ‘drop role G_CLASSIFIER’;
end if;
-- Create the role and grant privileges
dbms_output.put_line(‘-> Creating role: “G_CLASSIFIER”.’);
execute immediate ‘create role G_CLASSIFIER’;
dbms_output.put_line(‘-> Granting privileges to G_CLASSIFIER’);
execute immediate ‘grant CONNECT to G_CLASSIFIER’;
execute immediate ‘grant select any table to G_CLASSIFIER’;
execute immediate ‘grant select any dictionary to G_CLASSIFIER’;
-- Re-add existing members, if any
if (memberCount > 0) then
dbms_output.put_line(‘-> Restoring (‘ || memberCount || ‘) G_CLASSIFIER role members.’); for i in 1..memberCount loop
dbms_output.put_line(‘-> Restoring member: ‘ || members(i) );
execute immediate ‘grant G_CLASSIFIER to ‘ || members(i);
end loop;
end if;
dbms_output.put_line(‘<<< -========================================================<<<’);
dbms_output.put_line(‘<<< …Creation of the G_CLASSIFIER role is complete!’);
dbms_output.put_line(‘<<< -========================================================<<<’);
end;
/
spool off
Same for VA:


Stop the file server by hitting ‘enter’ on the cli screen.
Provide these scripts to the database administrator of the prospective client and work with the DBA Admin to set up the sqlguard user and grant the roles or confirm that a properly entitled account will be used for the testing.
Prepare the Collector
Apply the PoC license keys and confirm that the guardium user has all appropriate roles selected
https://<guardium-collector-ip-address>:8443
- log in as admin / guardium
- apply the license keys
- log in as accessmgr / guardium
- make sure the guardium user has all roles selected
- log in as guardium / guardium
Check the S-TAP status and inspection engine default configuration
- check the S-TAP status

- Check the inspection engine default configuration

Confirm that the following options are selected, then restart the engines.

Confirm the inspection engines were configured automatically during the S-TAP installation, if not, create them manually
- For example, here are two inspection engine parameters from a demo system for PostgreSQL and mongoDB
- PostgreSQL:


-
- mongoDB:

Confirm that Quick Search is active
Check Quick Search status: grdapi get_quick_search_info
If needed, start Quick Search: grdapi enable_quick_search includeViolations=true extraction_start=now schedule_start=now schedule_interval=5 schedule_units=MINUTE
Confirm that Outlier Detection is active
Start the Outlier detection: grdapi get_outliers_detection_info
If needed, start the Outlier detection: grdapi set_outliers_detection_demo_mode
Confirm that Threat Analytics is active
Check the threat analytics: grdapi get_threat_detection_use_case_info
Start the threat analytics: grdapi enable_advanced_threat_scanning all=true schedule_start=now
Confirm that the alerter is on at startup


Run the Smoke Test
-
- The Risk Spotter and Basic Security Policies should already be pre-installed and some level of data should already be flowing to the collector since they are non-selective policies. You might also need to use any custom PoC Use Case Dashboard(s) that you have pre-built per the success criteria in the event that the prospective client’s use cases may be different from the standard use cases.
- Go to My Custom Dashboards and use these pre-built dashboard reports to check for activities flowing through to the collector:
- [DAM] Data Activity Reports
- Session

-
- if no activity, ask a DBA to log into the server and run a few short commands, recheck the report
- sample commands are available if the DBA does not have a workload ready to use (see PDF file for example commands)
- if no activity, check the S-TAP events report: Reports->Real-Time Guardium Operational Reports->S-TAP Events
- restart the S-TAP if using GIM, if not, on the database server check to be sure it’s running:
- Linux/Unix: pa – aef | grep tap
- Windows: start the services app and confirm that the Guardium process is running and is started automatically
- From the collector GUI, check S-TAP status monitor to see if heartbeat is connecting
- From the collector GUI, check S-TAP control to see if the inspection engines are OK and S-TAP is green
- ask the DBA to generate some failed logins to the database and then check the ‘Exceptions’ report since failed logins are always captured even if no policy is installed
- check the ports
- restart the sniffer (if down)
- stop inspection core, start inspection core
- check the local tap logfile:
- Linux/Unix: find / -name *tap*.log (/var/log/ktap_install.log)
- From the GUI – check the S-TAP Events report
- Check the advice in the Security Learning Academy for troubleshooting S-TAPs
- Here is the link:
- If nothing obvious, ask for help from PoC Swat Team in slack
- restart the S-TAP if using GIM, if not, on the database server check to be sure it’s running:
- if no activity, ask a DBA to log into the server and run a few short commands, recheck the report
Configure VA

Configure and run a VA
Review the activity
Review the activity that has been collected so far and populate the groups used by the Basic Security policy
Reinstall the policy after adding group members
Use the Policy Analyzer
(use ad hoc report) for the Basic Security Policy to see if any of the rules are firing [latest logs and violations]
Smart Assistant will be pre-configured for GDPR as the test case
- populate some of the GDPR-related groups
NOTE: *DO NOT RUN Setup* - it will fail because you can *not* install a selective policy while a non-selective policy is installed; the classification process should already be pre-configured so that you can open the GDPR window (in Smart Assistant), show the classification policy rules, click on ‘go to classification’ and run the process, show the matches, it will automatically populate the ‘GDPR Sensitive Objects’ group, then the GDPR reports will populate once traffic is run against those groups.
(the NA Top Team is working on a non-selective policy rule so that this error can be avoided)
Review the GDPR reports as they begin to populate
Check on the Active Threat Analytics and Risk Spotter on occasion
Significant results are not expected there until at least 24-36 hours.
Check the Dashboard Reports
View contents of any dashboards that were pre-configured and any that were customized and imported. Look at violation report, unauthorized access to ‘sensitive objects’, etc., other GDPR related reports, DDL, DML, GRANT, REVOKE, etc.
Show compliance dashboard, Data Protection dashboard, etc

Set up audit process work flow
Review the audit process workflow with the client and send some reports to the Guardium todo list.
Send violations to messages report (SYSLOG)
Start the 4 daemons to send to siem: Store remotelog all.all <host:port> tcp
Use the ‘Alerts’ messages report ( ) to show that they were sent to SYSLOG.
Entitlement Reports
Test the upload process for entitlements through the GUI – if successful, modify and run the grdapi scripts to populate the rest of the tables


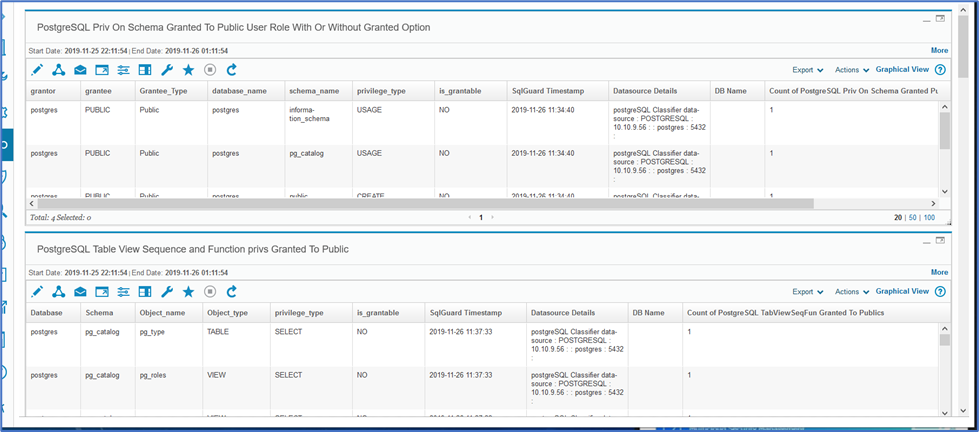
Add the entitlement reports to an audit workflow and check the box to only report on differences.
Vulnerability Assessment
Check the Smart Assistant Compliance Monitoring Dashboard to be sure the classification process ran and was successful and populated the appropriate group. Then verify that the VA results show up in the Data Protection Dashboard.
Confirm that the pre-configured VA dashboard is populated.
Standard Client Use Cases for Guardium Data Protection
Client Use Case: Reduce the data risk landscape
-
- IBM PoC Success Criteria Line Item: Database discovery & data classification
- Goal: Determine where the databases exist
- Task: Run auto discovery
- Proof of Success: show databases discovered list
- Goal: Identify sensitive data on the databases (data sources)
- Task: Use Smart Assistant to set up OOB classification, policies and reports
- Task: Configure classification policy to auto-populate the sensitive objects table
- Proof of Success: show the classification results and the populated group
- Client Benefit/Use Case: If any data objects were classified as sensitive, a report would be set up to notify the data owner and they will determine the level of risk and how to proceed (protect with Guardium, archive the data off-line or delete the data). If not, there may not be a need to protect, but may be a need to still monitor and run classification on a regular basis to be sure no sensitive data shows up later on
- IBM PoC Success Criteria Line Item: Database discovery & data classification
Client Use Case: Identify servers that might be under attack or there is a possible attempt at unauthorized usage
- IBM PoC Success Criteria Line Item: Raise awareness of unusual access attempts
- Goal: Report on unusual access
- Task: raise alerts on multiple failed login attempts through data activity policy configuration
- Proof of Success: violation report
- Client Benefit/Use Case: a hacker (or bot) may be trying to guess username/password combinations
- Goal: Report on possible SQL injection (requires a specific workload)
- Task: ask the client to run a workload in their own environment to simulate a SQL injection attack (discuss our simulation workload as an example) – OR – suggest that we provide a demo on our PoT laptop showing the simulation
- Proof of Success: SQL Injection Report with symptoms
- Client Benefit/Use Case: a hacker (or bot) may be trying to gain access to the server- IBM PoC Success Criteria Line Item: Raise awareness of unauthorized access
- Goal: Report on unauthorized access
- Task: raise alerts on SQL activity that is not within normal business parameters through the use of a policy that alerts on activity that is *not* a combination of normal parameters and group members; the client (or Guardium SME) must include db usernames, ip addresses or server names (based on how Guardium sees them in the ‘allow-all smoke test report’) in the group members and then run SQL commands intended to violate the policy.
- Proof of Success: Dashboard: violation report, sensitive objects report, DML, DDL, GRANT, REVOKE, etc.
- Client Benefit/Use Case: become informed in real-time if the server is under attack or if a user (or stolen credentials of a user) is accessing information outside of their normal business operations.
- Goal: Report on unauthorized access
- IBM PoC Success Criteria Line Item: Raise awareness of unauthorized access
Client Use Case: Meet audit and compliance requirements
- IBM PoC Success Criteria Line Item: help meet regulatory compliance controls
- Goal: Demonstrate quick configuration of OOB policies and reports for audit and compliance
- Task: use Smart assistant to configure OOB compliance setup, select data sources, run setup, populate groups as needed
- Proof of Success: show how the dashboard gives a view into compliance coverage for the servers in play- Client Benefit/Use Case: the DBAs can report to upper management on the compliance coverage for the servers at the enterprise level
Client Use Case: Provide C-Level executives with a sense of data security across the enterprise
- IBM PoC Success Criteria Line Item: provide a dashboard that shows multiple data security KPIs across the known data servers in the enterprise
- Goal: Show meaningful KPIs on the Data Protection Dashboard
- Task: make sure the pre-reqs for the dashboard are running so that the screen populates properly
- Proof of Success: show multiple data security posture KPIs on the dashboard (limited to 7 day window – meant to be a current view)
- Client Benefit/Use Case: Upper management could view the dashboard on a ‘Soc-like’ monitor running continuously to see the level of compliance coverage and vulnerability assessment for the servers at the enterprise level or the DBAs and IT managers could provide a screenshot of the dashboard on a scheduled basis or at weekly meetings.
Client Use Case: Identify anomalous behavior
-
- IBM PoC Success Criteria Line Item: Raise awareness of activities that are not part of regular business operations
- Goal: Show anomalous behavior through the use of the Active Threat Analytics and Risk Spotter Dashboards, possibly the Investigative Dashboard
- Task: a sufficient workload will need to be run over a minimum number of days for Guardium to be able to ‘learn’ what is normal in order to identify anomalies. If this scenario is not possible within the time frame of the PoC, it could be demonstrated through the use of our simulation environment (PoT laptop or skytap environment), still offering to work with the client if they wish to run their own appropriate workload over a minimum of two weeks.
- Proof of Success: Show the results on the Active Threat Analytics, Risk Spotter and Investigative Dashboards
- Client Benefit/Use Case: Guardium’s machine learning capabilities will augment the activity monitoring policies by analyzing all activities that come into the appliance over time.
- IBM PoC Success Criteria Line Item: Raise awareness of activities that are not part of regular business operations
Client Use Case: Ease of implementation, scale and maintenance
- IBM PoC Success Criteria Line Item: Discuss the Guardium architecture, ease of implementation using the Smart Assistant, ease of scale through the automatic registration of additional appliances to central managers, grdapi scripting, RESTful APIs, ease of growth potential using GBDI and admin policies for use in maintenance.
- Goal: Enlighten the client on how Guardium customers with large deployments are achieving efficient levels of implementation and maintenance.
- Task: Presentation from IBM Product Professional Services Team and Guardium Offering Management
- Proof of Success: Client reference stories and examples, possibly a roadmap discussion as appropriate.
- Client Benefit/Use Case: As clients continue on the digital transformation journey from on-prem to a combination of on-prem, on-cloud and hybrid environments, requiring processing of increased amounts of data ingested on a daily basis, their data security requirements evolve as well. Guardium meets these needs and continues to mature as we co-develop next generation data security techniques with our clients.
Client Use Case: Reduction in reliance on IT department resources through the use of automation where applicable
-
- IBM PoC Success Criteria Line Item: Demonstrate the use of a workflow engine to automate reporting.
- Goal: Through the use of a workflow engine, reports can be automatically sent to recipients.
- Task: set up the audit process workflow
- Proof of Success: reports are generated and appear in a task list for review, sign off or escalation
- Client Benefit/Use Case: by using Guardium’s workflow engine, the IT department does not need to generate reports that are required by audit departments on a manual, interrupt-driven basis. These reports can be scheduled to run automatically, be sent to the appropriate persons and/or departments and can be tracked for review and signoff.
- IBM PoC Success Criteria Line Item: Demonstrate the use of a workflow engine to automate reporting.
Client Use Case: Integration with appropriate product solutions that are already in use (don't want to rip & replace)
- IBM PoC Success Criteria Line Item:
- Goal: Use the standard global profile template to send alerts to SYSLOG and if possible, send them to a SIEM
- Task: push alerts to a SIEM or to SYSLOG by setting up the alert notification in the policy and starting up the 4 daemon processes which will forward the messages to the SIEM
- Proof of Success: show the alerts being processed by the Guardium ‘Messages’ report and possibly as they appear on the client’s SIEM reports.
- Client Benefit/Use Case:
PoC Wrap-Up
Create the PoC Wrap Up Document and present the results
Take screen shots as PoC items are proven out to be successful.
Prepare the PPT presentation
Include sections with ‘Why IBM’, customer testimonials, on-line resources, etc.
Confirm availability of Expert Lab Services resource to present the implementation overview
Confirm Guardium OM availability to present roadmap if appropriate
Schedule time to present to the client stakeholders
Schedule PoC clean-up activities as needed